
(no title)
tsax | 10 years ago
http://www.aoml.noaa.gov/hrd/hurdat/All_U.S._Hurricanes.html
http://www.aoml.noaa.gov/hrd/Landsea/gw_hurricanes/fig33.jpg
tsax | 10 years ago
http://www.aoml.noaa.gov/hrd/hurdat/All_U.S._Hurricanes.html
http://www.aoml.noaa.gov/hrd/Landsea/gw_hurricanes/fig33.jpg
exclusiv|10 years ago
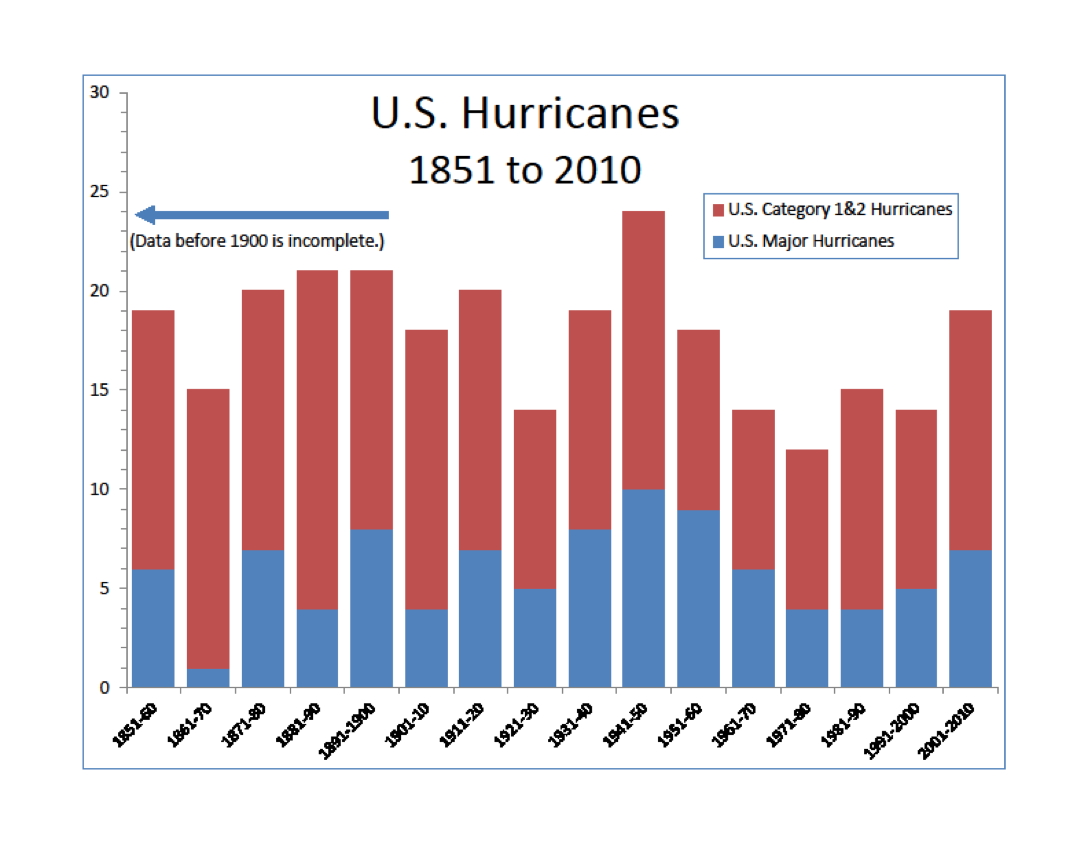
Can you explain why 1850 looks comparable or worse than the 1990s and worse than 2010s so far? I don't see what this proves.
The inputs for "man's impact" in the 1850s would not come close to modern day. If we took that into account, by your logic, the bar charts should explode out the top! But it doesn't. Not even close.
1850 - 1.2B people 2010s - ~7B people and a lot more pollution
From your linked data, the impact of AGW on hurricanes over the last year = 0
Edit: I think you may agree with me that it doesn't point to more extreme weather events. If so - my comment is directed at the parent.
tsax|10 years ago
unknown|10 years ago
[deleted]