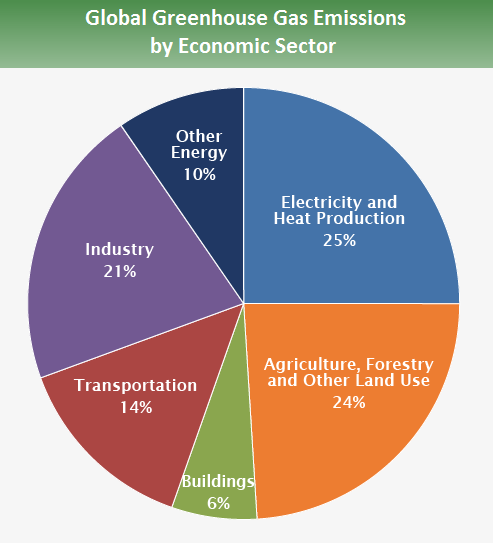
top | item 24604713 (no title) jekdoce | 5 years ago Here is a pie chart (globally) from epa.gov: https://www.epa.gov/sites/production/files/2016-05/global_em... discuss order hn newest No comments yet.

No comments yet.