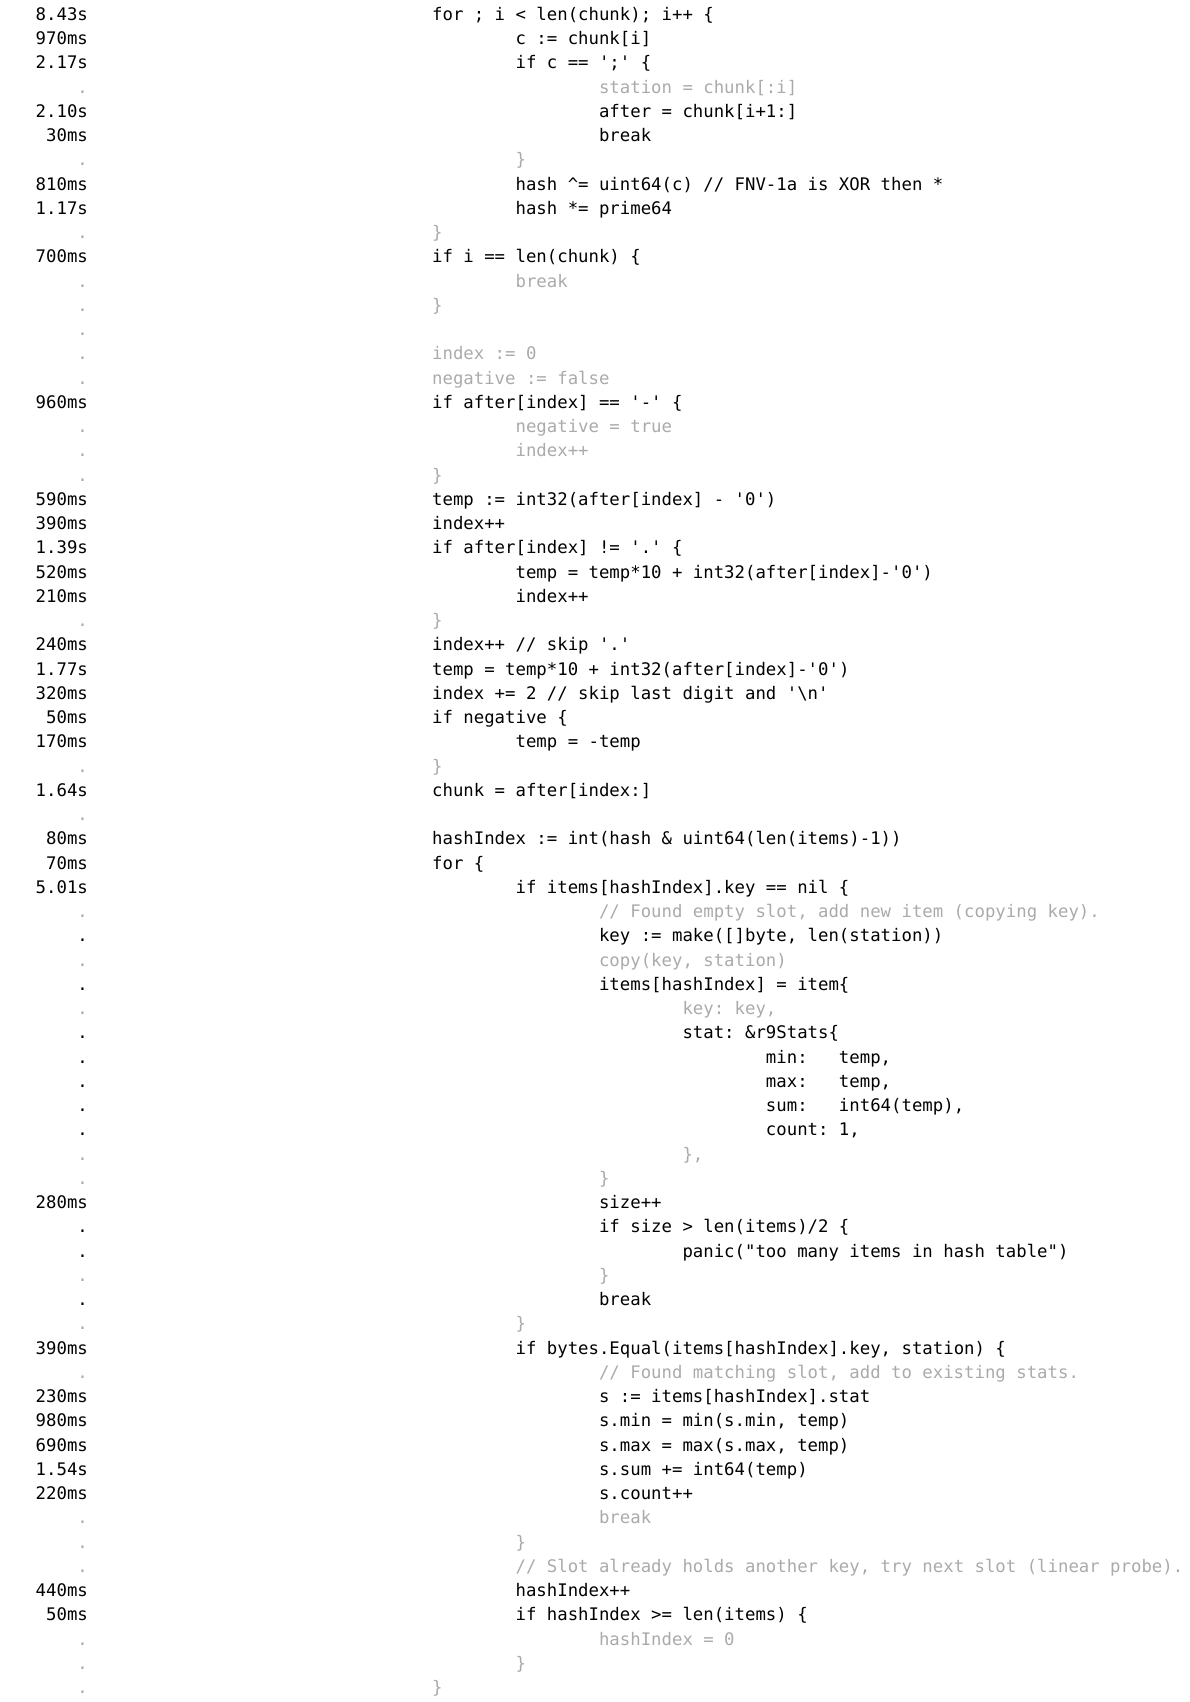
top | item 39583115 (no title) Beltalowda | 2 years ago How did you generate the timings on: https://benhoyt.com/images/go-1brc-profile-r9-source.png ? discuss order hn newest benhoyt|2 years ago Using Go's profiling tool with its "source" view: I used "go tool pprof -http=: cpu.prof", where cpu.prof was generated by "go-1brc -cpuprofile=cpu.prof -revision=9 measurements.txt". Beltalowda|2 years ago Cheers; I've always difficulty mapping those pprof graphs to actual concrete code and I never managed to get anything more useful out of it.This is the biggest take-away from this post to be honest; had no idea it could do anything like that. Sometimes it's the little things...You can get something similar with the CLI using: go tool pprof -weblist='mypkgname' cpu.out # Generate HTML and open go tool pprof -list='mypkgname' cpu.out # Generate text to stdout
benhoyt|2 years ago Using Go's profiling tool with its "source" view: I used "go tool pprof -http=: cpu.prof", where cpu.prof was generated by "go-1brc -cpuprofile=cpu.prof -revision=9 measurements.txt". Beltalowda|2 years ago Cheers; I've always difficulty mapping those pprof graphs to actual concrete code and I never managed to get anything more useful out of it.This is the biggest take-away from this post to be honest; had no idea it could do anything like that. Sometimes it's the little things...You can get something similar with the CLI using: go tool pprof -weblist='mypkgname' cpu.out # Generate HTML and open go tool pprof -list='mypkgname' cpu.out # Generate text to stdout
Beltalowda|2 years ago Cheers; I've always difficulty mapping those pprof graphs to actual concrete code and I never managed to get anything more useful out of it.This is the biggest take-away from this post to be honest; had no idea it could do anything like that. Sometimes it's the little things...You can get something similar with the CLI using: go tool pprof -weblist='mypkgname' cpu.out # Generate HTML and open go tool pprof -list='mypkgname' cpu.out # Generate text to stdout

benhoyt|2 years ago
Beltalowda|2 years ago
This is the biggest take-away from this post to be honest; had no idea it could do anything like that. Sometimes it's the little things...
You can get something similar with the CLI using: