
(no title)
mikeayles | 6 days ago
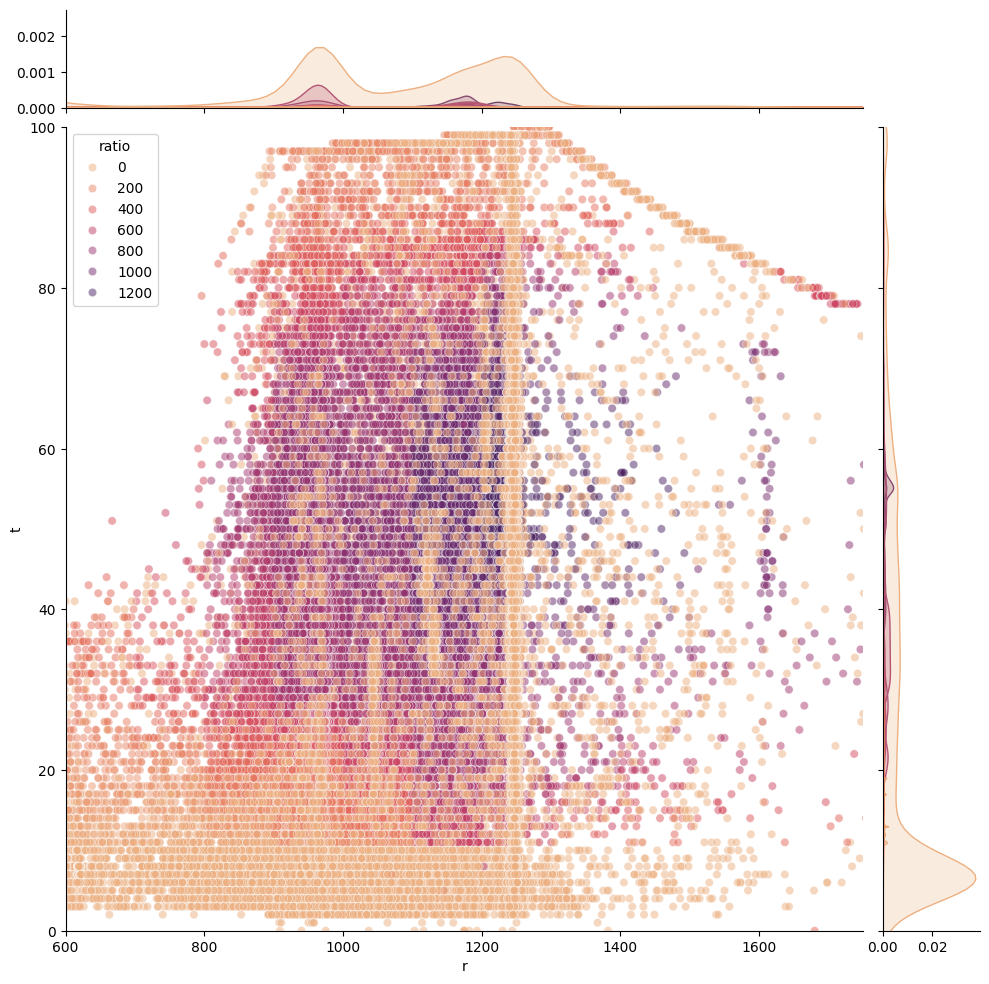
https://www.mikeayles.com/torque-rpm-time.png
So, here is approximately a weeks worth of data (around 700l of diesel), looking at the histogram on the right hand side, theres an awful lot of time spent at 0-10% this is around 60% of the trucks time.
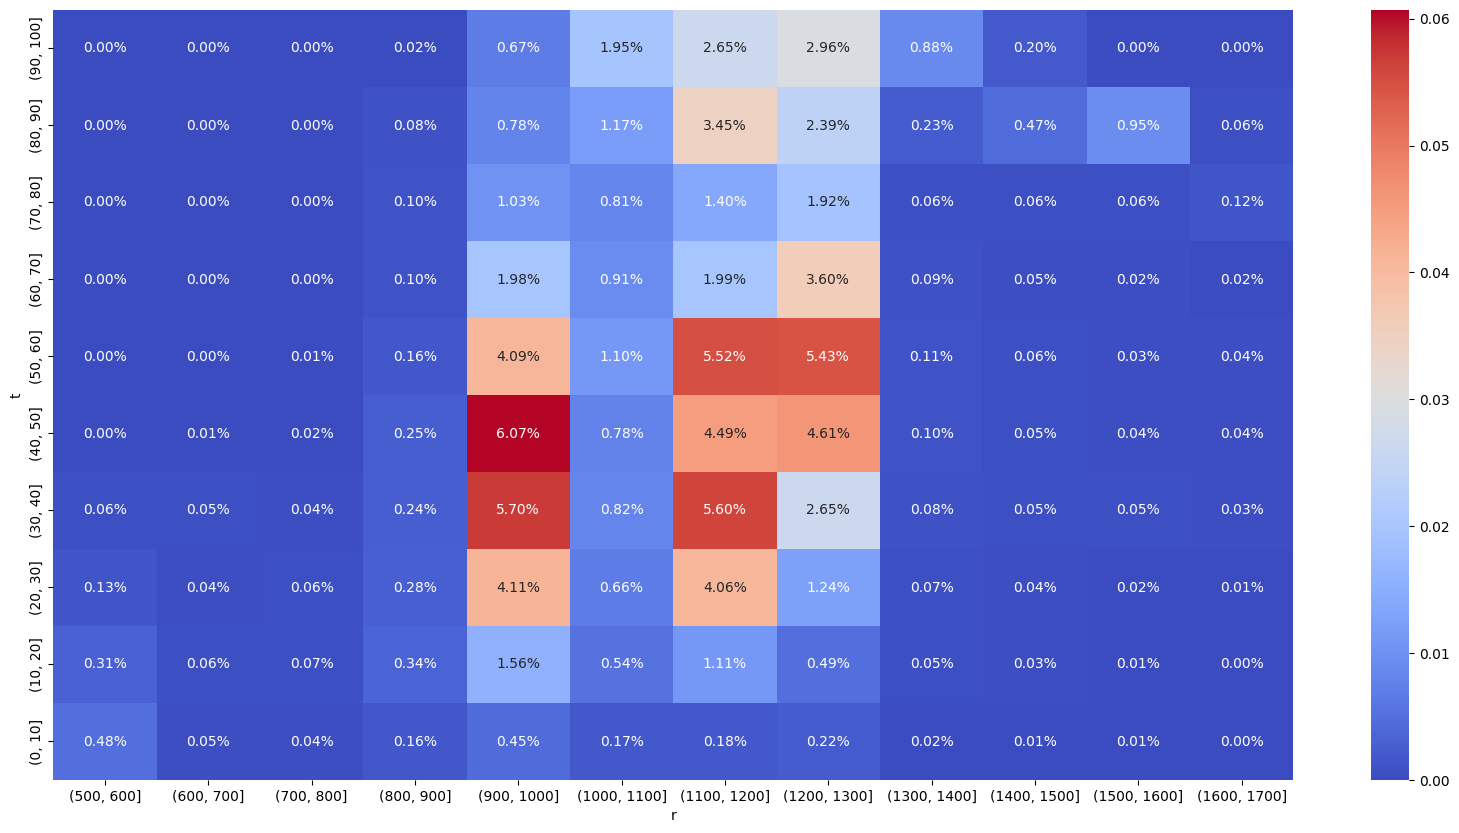
https://www.mikeayles.com/torque-rpm-volume.png
However, when you multiply the time by the fuel consumption within that same time period, you get a volumetric chart, where we can see that 60% of the time, accounts for only 2% of the fuel use.
So, for idling, whilst it's noisy, produces CO2, a 5% improvement at highway speed will get you so much more of a fuel and co2 saving than eliminating idle. although, both, do both.
niwtsol|6 days ago
Also, your 28.5M+ miles driven is such a great stat - thanks for sharing this knowledge!
mikeayles|6 days ago
This is detailed in J1939 (canbus protocol) PGN (parameter group number) EC1 (engine configuration 1) if you fancy a rabbit hole.
The vertical clusters will be a combination of gearing and cruise control, exactly. At the vehicle speed limit in the top gear (usually 12) most trucks will cruise around 1200rpm (exception being the scanias with supercruise). It's likely this truck did a lot of urban driving or was in average speed zones.
You also get a lot of drivers (suprisingly more younger than older drivers) that are happy to set it at 53mph, get the green tick for the telemetry to try and get a bonus, but then have a really low stress drive. It creates a bigger speed differential so they can be overtaken by other trucks easier, and realistically results in 10-20mins over a 10hr shift, to some, a 10hr chilled out shift is better than 9hr40mins of pushing it.
jfim|6 days ago
mikeayles|6 days ago
edit: images may be down for 5mins, migrating my blog to astro.